


Equity compensation has become an increasingly important component of worker pay in today's labor market. The prevalence and distribution of equity compensation have direct implications for labor supply decisions (firm choice, tenure), as well as for estimating income and wealth inequality, However, our comprehensive understanding of the landscape of equity compensation is limited by a simple fact: it is hard to systematically study. Most forms of employer equity compensation, such as stock grants, only manifest in tax returns as ordinary wage income upon vesting, while other forms, such as stock options, are only observed upon exercise and may never appear if options expire worthless.
As a result, equity compensation is largely invisible as a distinct component in administrative data settings, and researchers are often forced to rely on surveys, which face limitations such as sampling bias (in the case of non-scientific surveys) and severe underrepresentation of small groups, such as very top earners or certain intersections of identity.
This week, we turn to an alternative data source to shed light on this gap: levels.fyi, a popular pay transparency platform where tech industry workers voluntarily and anonymously share their compensation packages, including detailed breakdowns of salary, equity, and bonus. Revelio Labs collects and standardizes this data, and we use it to study the structure and distribution of equity compensation among US tech workers. While the sample is likely subject to selection bias, reflecting workers who choose to report their compensation, it offers a novel and complementary perspective that is difficult to obtain from administrative or survey data alone.
In this newsletter, we restrict our sample to US contracts covering the period 2017 to 2025, which represent approximately 75% of the data. We reweight the sample to match company-year US headcounts. We focus specifically on the most common form of regular annual equity compensation—restricted stock units (RSUs) or stock grants, as opposed to options and other forms of equity. Lastly, we measure equity at grant value; realized values will differ depending on stock performance and vesting outcomes.
We study who receives equity and which companies offer it, how equity enters into the distribution of earnings, and whether employers trade off ordinary wages and stock compensation.
Which employees receive equity? Which companies pay equity?
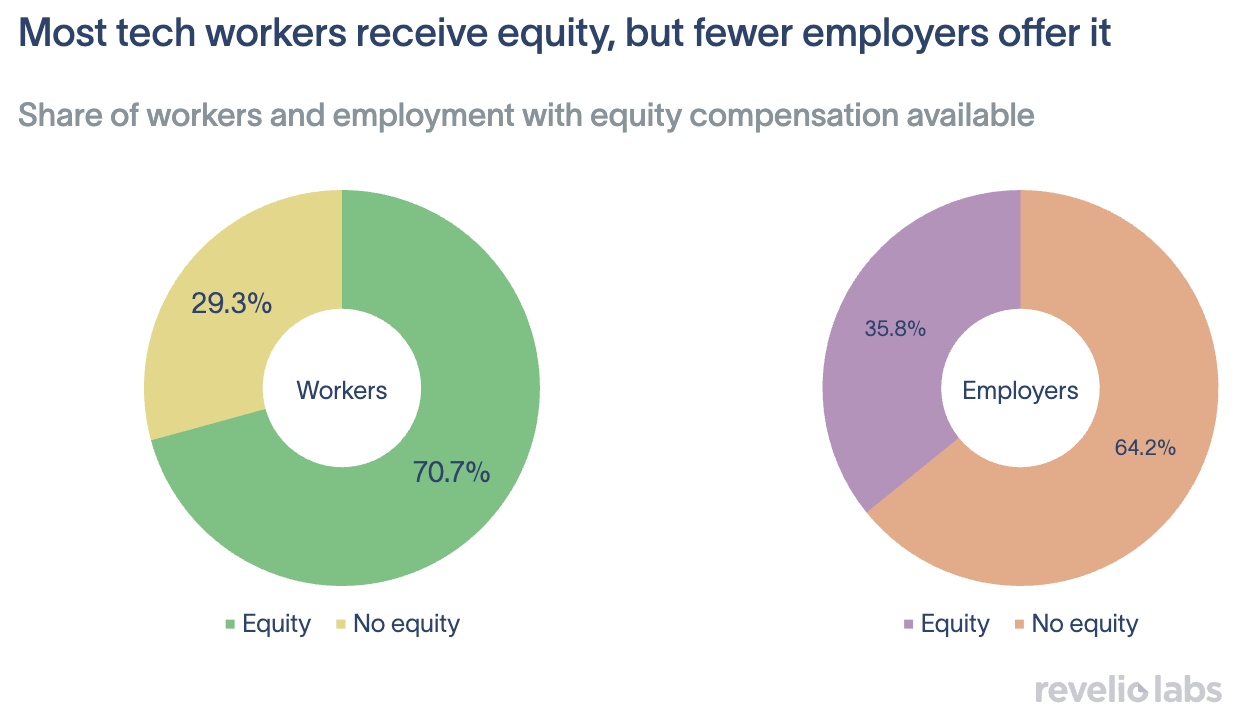
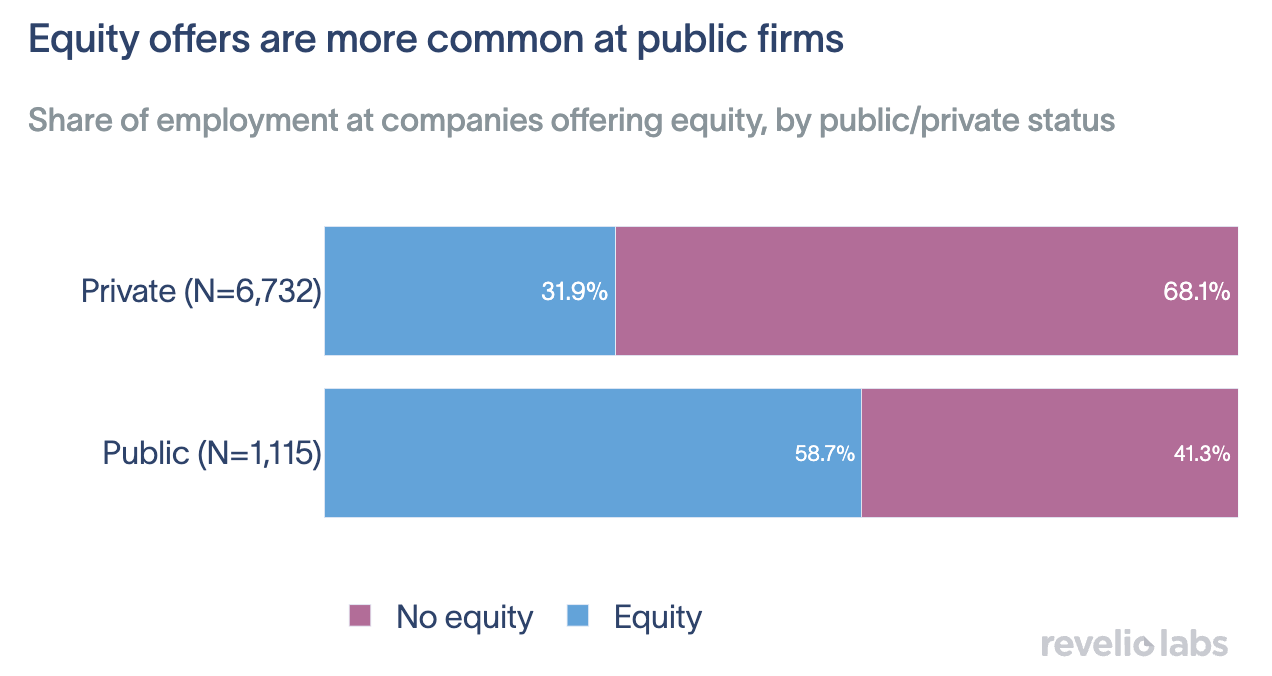
In our sample of tech workers who report their compensation on levels.fyi, we find that 70% receive equity, while only around one-third of companies are observed offering stock compensation. This discrepancy implies that larger firms tend to offer equity compensation at greater frequency than smaller firms, a pattern consistent with the broader view that equity compensation is concentrated at larger, publicly-traded tech firms, where it has become a near-universal feature of compensation packages. This intuition is confirmed in our data, where we observe that publicly-traded companies offer equity at significantly higher rates than their private counterparts.
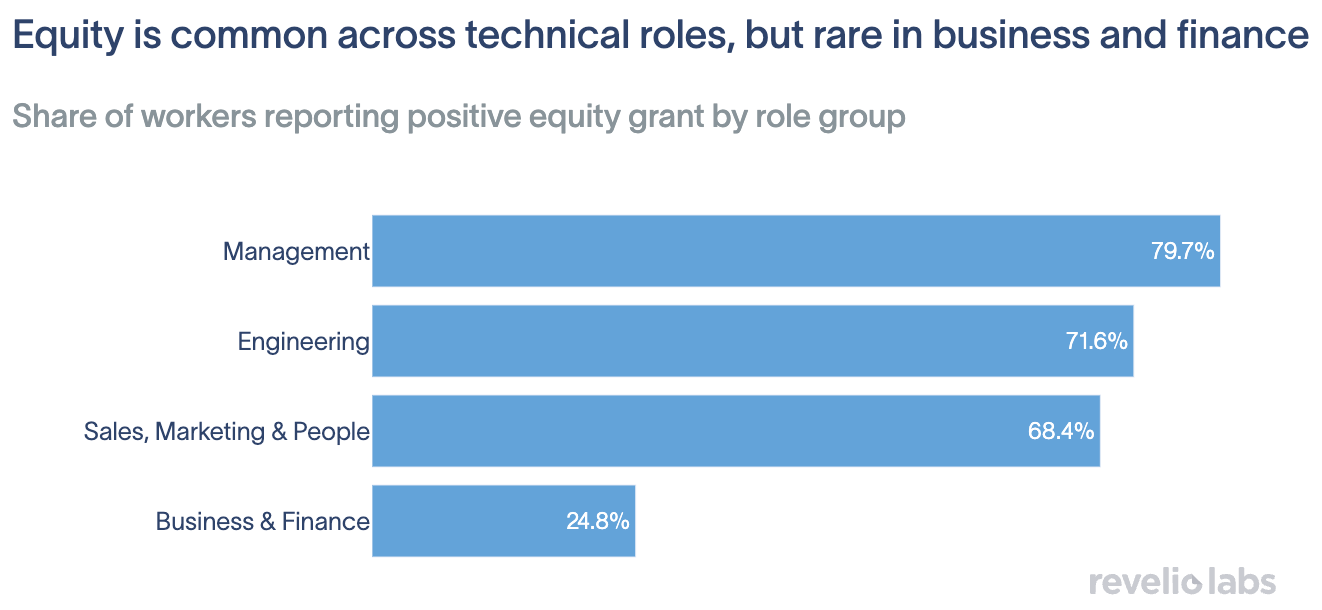
Equity receipt is common across most worker types. Perhaps most striking is that only 25% of workers in business and finance roles report receiving stock compensation—well below any other group. While we cannot separate different stages of the offer and negotiation process, this observation likely reflects some combination of several factors: employees in these roles may work at companies that offer equity less broadly; equity may be less commonly extended to non-technical functions even at firms that do; or, these professionals may be more likely to negotiate away equity in favor of higher cash compensation, given their familiarity with the risks of concentrated stock exposure and the time required for equity value to materialize. Not pictured here, we also observe a slight positive association between receiving equity and both employees’ tenure at a company and their years of overall experience, which may reflect either the effect of seniority on equity eligibility or changes in equity compensation practices over time.
What is the relationship between base pay and equity?
We find a positive correlation between base pay and the probability of receiving equity: a 10% increase in base pay is associated with a 5 percentage-point increase in the probability of receiving stock compensation. We estimate that a 1% increase in wage compensation carries a 6.6% increase in equity compensation.
This positive relationship also speaks directly to the question of whether equity and base pay operate as substitutes or complements. A simple substitution story would predict a negative relationship: firms paying more equity should pay less in cash. On the other hand, if instead they operate as complements, equity and base pay move in the same direction. One explanation for the complementarity we observe is that firms offering equity tend to be larger, more established, and higher-paying across the board. Equity is simply another dimension on which these firms compete for talent, alongside higher base pay. Under this view, equity and cash wages are both signals of employer quality rather than substitutes for one another. Additionally, equity is illiquid, risky, and subject to vesting—and represents a poorly diversified asset, since its value is tied to the same firm whose fortunes determine the worker's employment security. These issues may be particularly acute at private firms, where equity may never materialize into realized value at all. Workers bearing these risks may therefore demand a wage premium as compensation, further reinforcing the positive relationship between equity and base pay. We find further evidence in favor of the complementarity view: even after controlling for company, job type, and worker experience, equity recipients continue to earn significantly higher base pay.
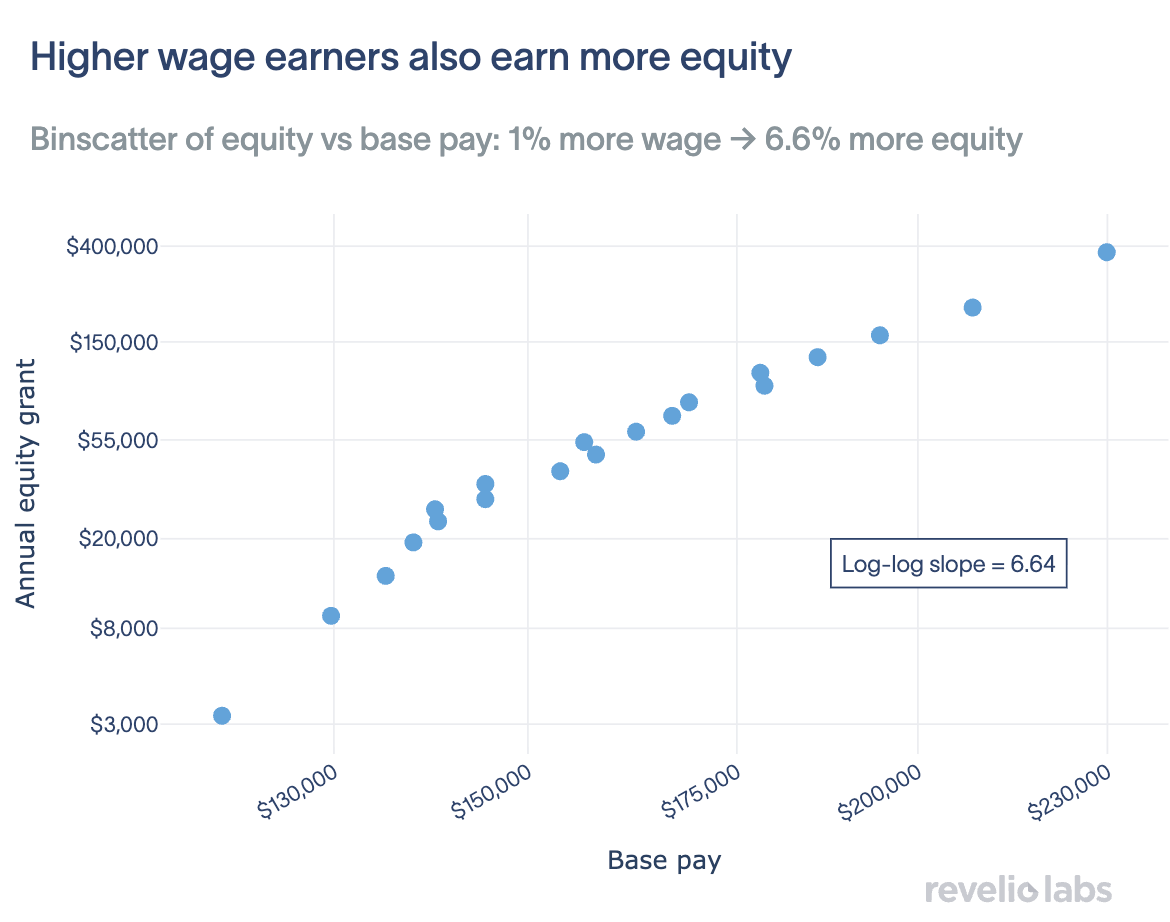
This steep gradient we observe—where equity grows far faster than wages—has a direct implication for inequality: workers at the top of the wage distribution receive disproportionately more equity, amplifying total compensation inequality beyond what wage data alone would suggest. Equity compensation has been identified as a key driver of earnings among C-suite executives and therefore a significant contributor to top-end inequality, but how has equity entered into the distribution of compensation among rank-and-file?
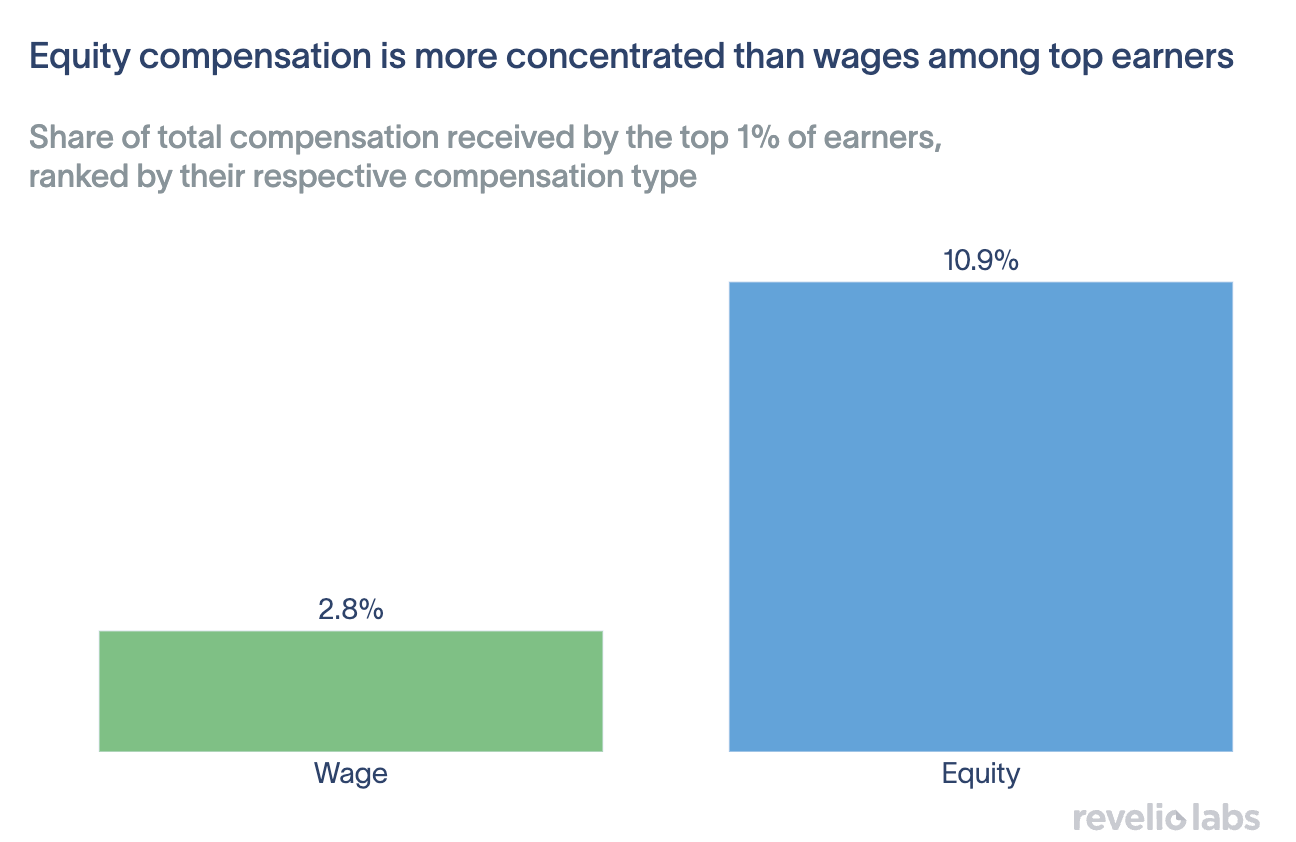
We plot the Lorenz curves for both wage and stock compensation along percentiles of the wage distribution. The Lorenz curve shows what share of total compensation is received by each cumulative share of workers. First, we observe relative wage equality among workers in Big Tech: the top 1% of earners in our sample capture only 2.8% of total wages, far below the US economy-wide top 1% wage share of 12.4% in 2023, consistent with greater wage compression in the tech industry. The top 1% of wage earners in the sample also receive around 4% of total equity.
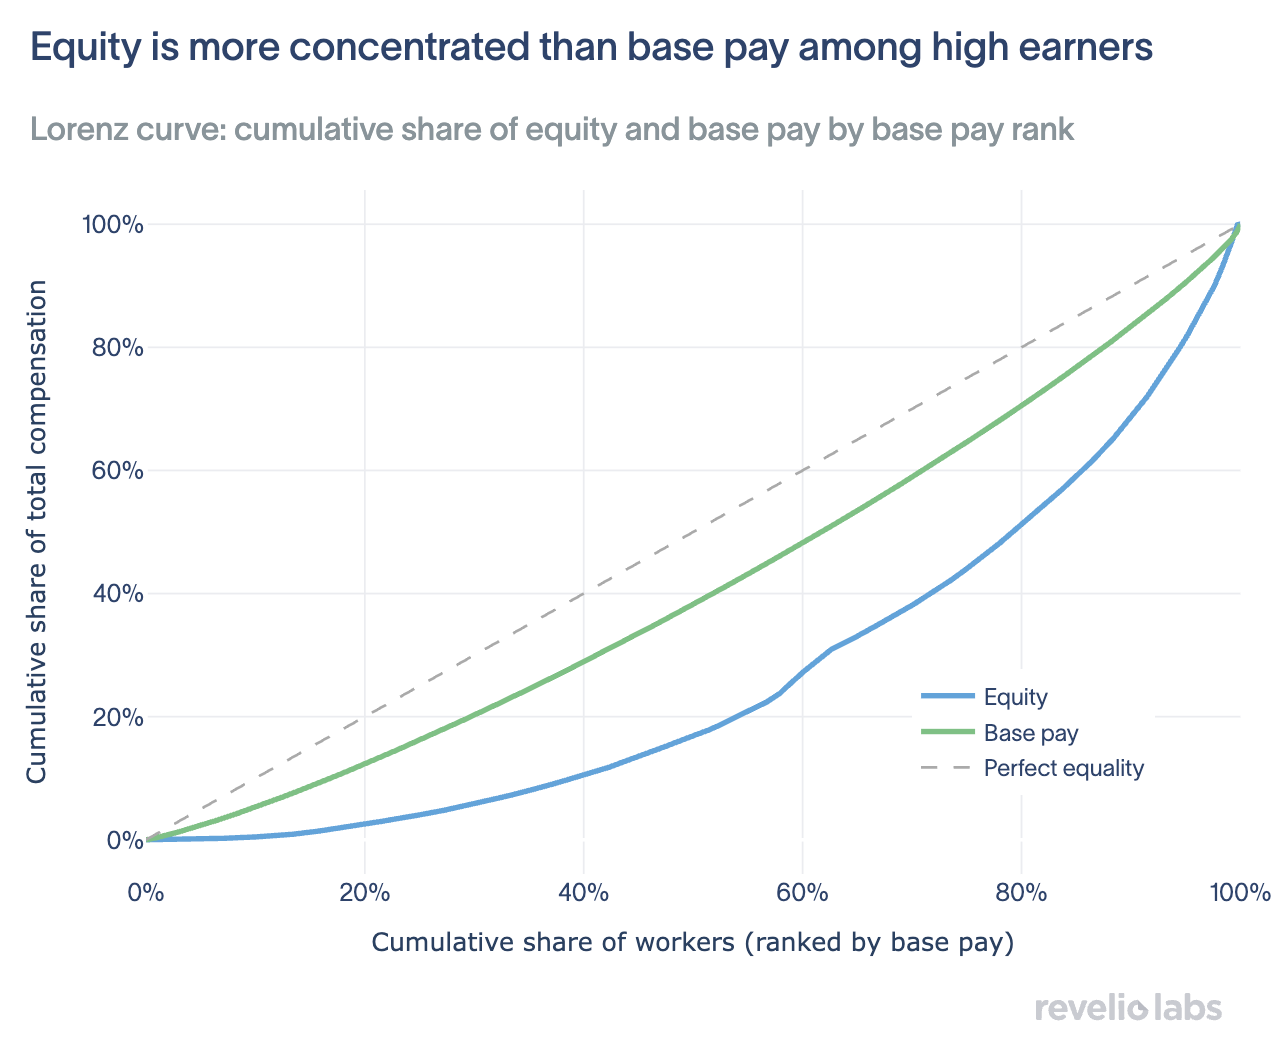
When instead we rank workers by their stock compensation, concentration is far more pronounced: the top 1% of equity recipients account for nearly 11% of all equity grants—four times the concentration we see in wages. This finding suggests that inequality in stock compensation operates somewhat independently of wage inequality, concentrated among a small number of workers receiving very large grants. It bears noting that these figures likely understate inequality in the broader economy, as our sample is restricted to tech workers, who are themselves among the highest earners in the US labor market.
Taken together, our findings paint a nuanced picture of equity compensation in the US tech sector. Equity is widespread—most tech workers receive some form of stock compensation—but its distribution is far from uniform. It is disproportionately received by higher-wage workers, amplifying rather than offsetting existing compensation inequality. As equity becomes an increasingly central feature of tech compensation packages, understanding its distribution becomes essential not only for workers navigating job offers, but for researchers and policymakers seeking an accurate picture of earnings inequality in the modern economy.


