Special Report: What Makes Up A Company?
We introduce two new taxonomies for company analysis

At Revelio Labs, we think a lot about taxonomies, which help us categorize and organize complex concepts. Most of the time we work on taxonomies related to employment (occupations, skills, seniority levels, etc), but today we’re turning our focus to taxonomies of companies.
We’re all familiar with the idea of an industry, a group of companies with a similar output. Companies are segmented into industries because it makes all sorts of analyses easier, such as analysis of who’s competing with whom. But the output of companies is only one part of a company. There’s also the input (the talent and equipment) and the inner workings (the work people actually do) that are equally important.
Today we’re going to revisit how industries are formulated and provide two new taxonomies similar to our job taxonomy and our skills taxonomy but are meant to take into account these other parts of companies, which will hopefully introduce more sophisticated ways to segment companies and deepen our understanding of what a company is.
Everyone who has taken a class in Economics has seen the Circular Flow Diagram, the simplest model of an economy. Here’s what it looks like:
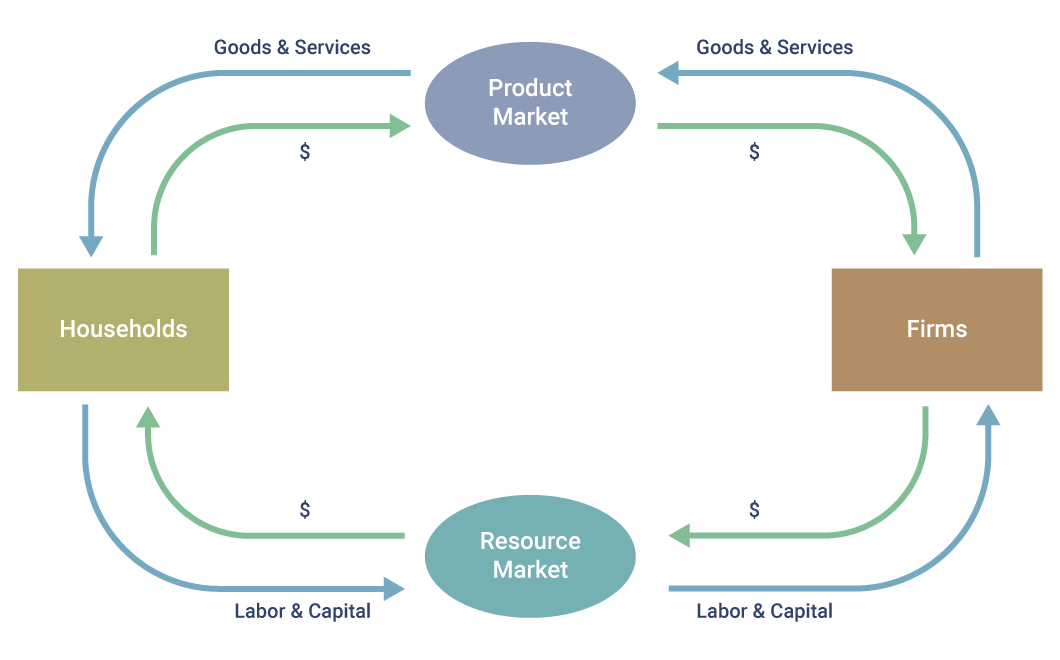
There are two entities: households and firms. Households sell resources to companies (labor and capital). Firms, in return, sell consumable goods and services back to households. In this model, households are endowed with labor and capital and want to convert those into more useful goods and services. From this perspective, a firm is a technology that turns labor and capital into consumable products.
We can, then, represent a company as the following function:
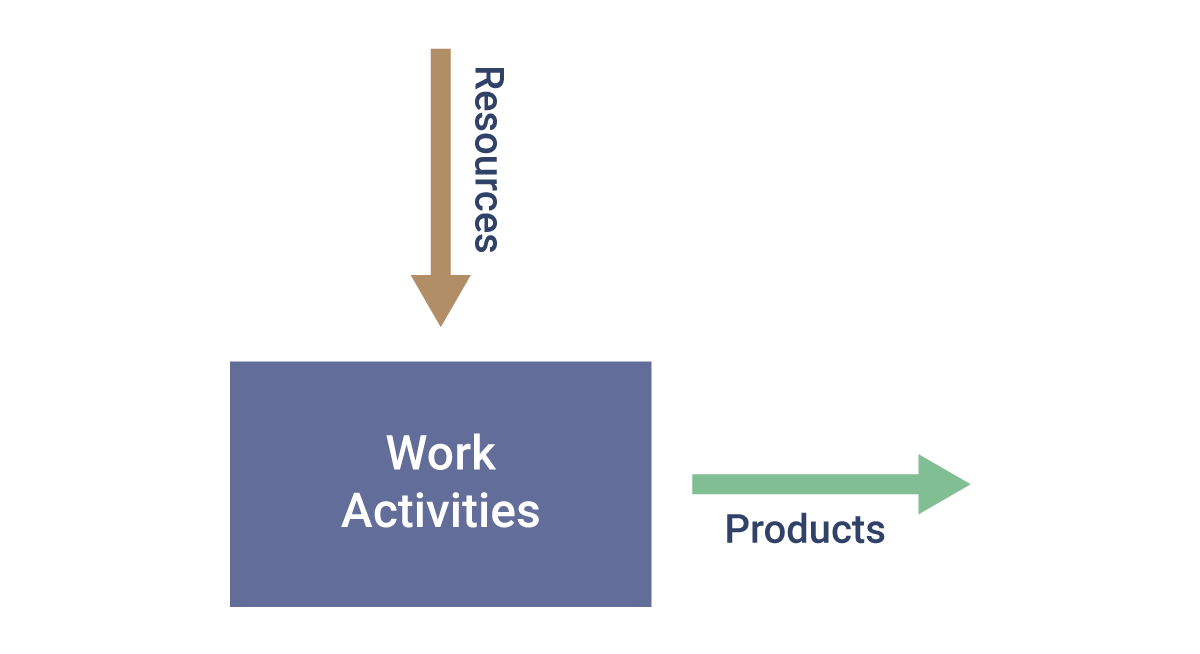
Of course, the magic of any function is what happens inside it. For a firm, this consists of work activities, which we break down into three parts: (i) buying resources, (ii) doing work, and (iii) selling products. It is entirely possible that each of these elements are independent of the other two. For example, Costco and eBay compete over the same customers, but do very different work and hire very different types of people. Salesforce and Blackstone compete in the same talent market but do not compete in other markets or do similar types of work. PepsiCo and UPS are organized around very similar work activities, but do not compete in the same labor markets or product markets.
Sign up for our newsletter
Our weekly data driven newsletter provides in-depth analysis of workforce trends and news, delivered straight to your inbox!
To see companies from these three perspectives, we construct a representation of each to see which companies are most similar to each on each of these dimensions:
(i) Product similarity: This is the easiest - it already exists in industry classifications.
(ii) Resource market similarity: From analyzing hundreds of millions of resumes and online profiles, we can identify the transitions that employees make from one company to another. Imagine a big graph where every company is a node and every transition is an edge, something that connects companies. Companies that are close together in this graph share the same talent and source talent from the same places.
(iii) Work activity similarity: From resumes, online profiles, and job postings, we can see how jobs are described (the bullet points on a resume/profile and the responsibilities section on a job listing). After parsing that text into distinct sets of work activities, we can see which companies have similar compositions of activities.
After constructing these distances, we wanted to see how they relate to each other. Here is the correlation matrix:

There are a few things striking about these correlations:
- They’re low! This means that each metric provides unique and valuable information that the others don’t.
- Product similarity is the most disconnected from the analytics tools. We think that’s especially notable since industry classifications are based on product similarity and are used as a proxy for all sorts of other similarities.
- The strongest relationship is resource market competition and work activity similarity. This makes sense if companies source talent to do similar things that they’ve done in previous companies.
We take a closer look at how these analytics tools relate to each other for a few different companies. Check out what we’ve found:
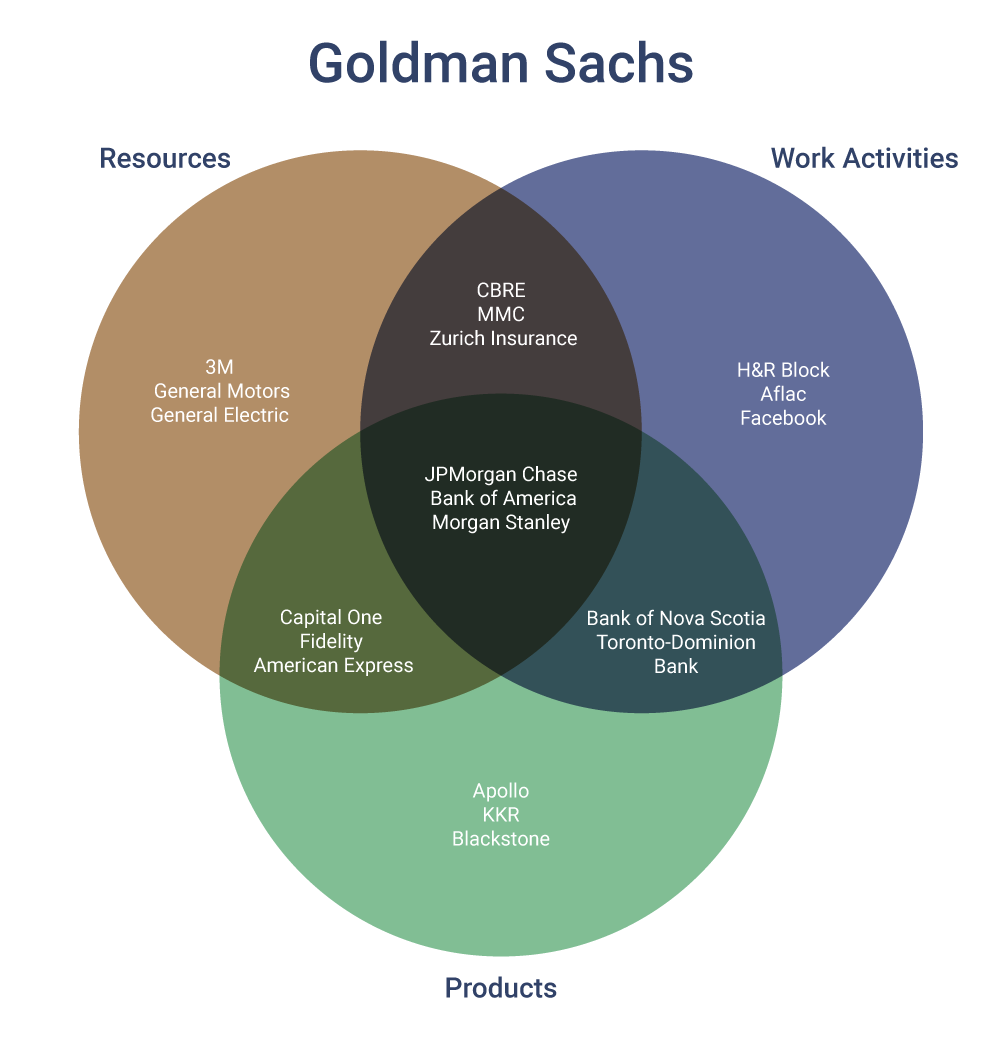
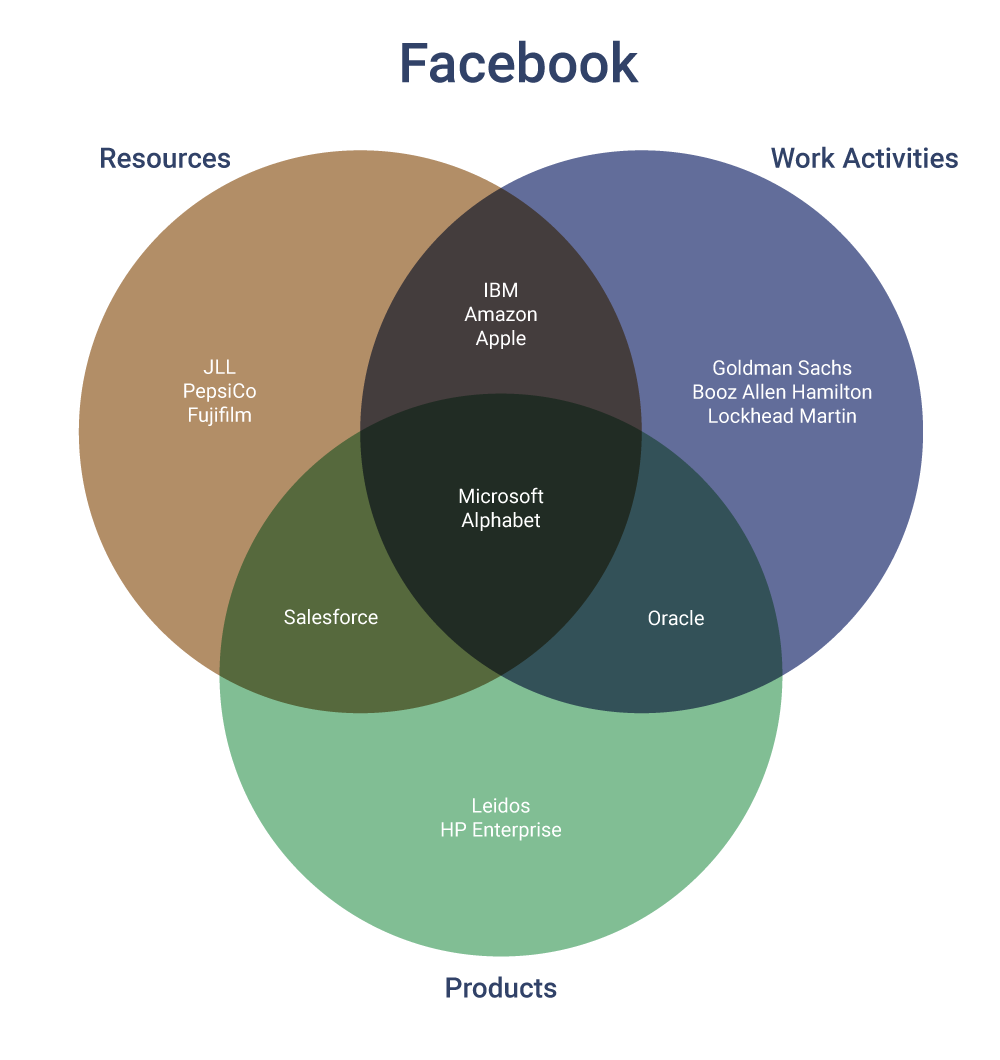
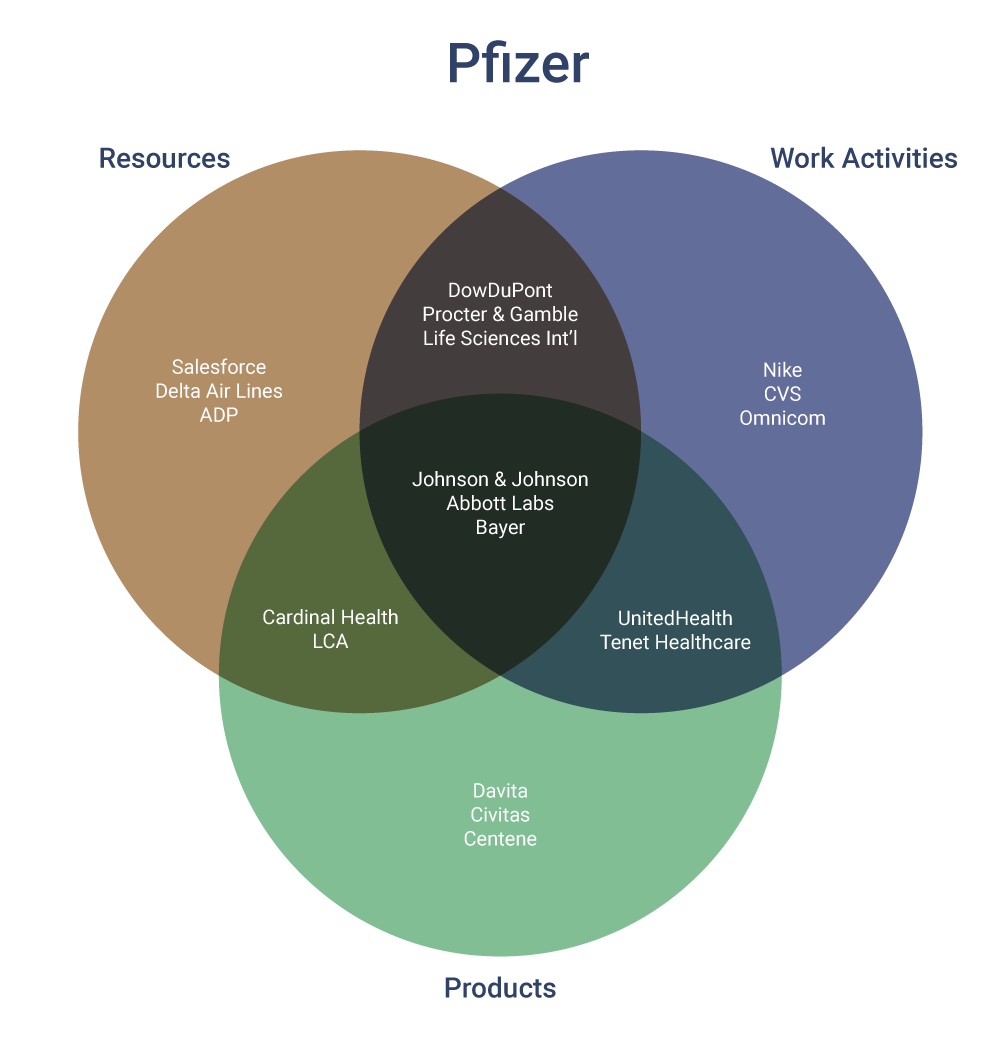
Robert Lucas famously said “Once you start thinking about economic growth, it’s hard to think about anything else.” At Revelio Labs, we feel the same way about taxonomies. The more we look at each plot, the more we learn about the nuances of each company. We hope that we can introduce a new and useful set of taxonomies like our job taxonomy and skills taxonomy for analyzing companies so that analysts can take a richer more holistic approach, and, ultimately, better understand companies.


